Single-name update · Memory · June 2026 outlook
June is when Micron has to do the work.
For most of May, Micron was a story about sell-side capitulation. More than a dozen verified analyst actions across eleven firms over five weeks. UBS tripling its price target to a Street-high $1,625. The stock running from $668 to $923.52 — up 38% in 17 trading days. By Friday I’d already hit my first trim level.
June stops being about narrative. FQ3 prints Wednesday June 24, after the close. Management guided $33.5B in revenue, 81% gross margin, and $19.15 in non-GAAP EPS. That’s the bar a $1 trillion market cap has to clear. The number that decides whether the rally is the start of something or the end of something.
What makes this print especially interesting: FQ2 was a 28% revenue beat and 45% EPS beat over what management told the Street to expect three months earlier. That kind of guide-versus-print gap is a tell about how conservative management has been. If even half of that pattern holds, FQ3 prints somewhere between “clear beat” and “blowout.” PT stays at $1,100. Next trim still at $1,100. The framework gets tested by an actual income statement instead of an analyst’s spreadsheet.
Six trading days; a 17% peak, a 20% drawdown, and a partial bounce. The $1,100 second trim never fired. Here is what actually happened from the moment we published this piece on Sunday night.
Monday June 1, the stock gapped above $1,000 and closed $1,035 (+12% on the day). Tuesday June 2 closed $1,064. Wednesday June 3, MU printed an all-time closing high of $1,079.57 — intraday it touched the $1,080s. The $1,100 trim trigger I described in this piece as “live, could fire this week” came within $20 of firing. It did not.
Thursday the tape broke. Broadcom reported FQ2 after the close Wednesday: Q2 AI semi revenue $10.8B (+143% YoY) and a Q3 AI semi guide of $16.0B (up over 200% YoY) — an aggressive near-term raise. But the Q3 total revenue guide of ~$29.4B came in slightly below the most aggressive Street models. The market read that as the first sign demand acceleration may be approaching a ceiling on the planning horizon, even though the in-quarter print was a record. MU fell 8% Thursday. Then Friday May payrolls printed +172,000 against an +80,000 consensus (AHE +3.4% YoY, UE 4.3%, prior months revised +29K Mar / +64K Apr — per the BLS May 2026 Employment Situation release). The 10-year went back through 4.5%; Fed cut odds collapsed; rate-hike odds rose to 70%. The Philadelphia Semiconductor Index posted its worst single session since April 2025. MU fell another 13% to $864.01 — back below where we entered the week.
Today (Monday June 8), the bid is back. Wells Fargo raised PT from $550 to $1,220 (+122%; Buy reiterated) and Cantor Fitzgerald moved from $700 to $1,500 (Overweight; called MU a “top pick”; analyst C.J. Muse: “the memory trade is alive and well” with chips undersupplied through 2028). MU is +8% intraday around $948 as I write this. The peak-to-trough drawdown was 20%; the pullback retraced most of the move from $923 → $1,079. We are now sitting roughly between Friday’s low and last Friday’s close.
What this means for the position. We trimmed one-third at $919 on May 29. We did not trim a second time. The remaining two-thirds round-tripped from $1,079 back down to $864 and now to $948. The position is still ~4% of book and the ladder is unchanged. The first trim looks better in hindsight than it did three days after publication. We sold near the local top — within $156 of the actual peak — and the framework worked exactly as intended: take risk down into strength, do not predict the top.
What this means for the thesis. The pullback flushed weak hands and the sell-side responded by raising, not cutting. That is the cleanest possible read on cycle durability. Wells Fargo and Cantor both came in with the same framing as the rest of the cascade — memory tight through 2028, hyperscaler capex unrelenting, FQ3 print on June 24 the next catalyst. The bear interpretation (Broadcom Q3 total guide light + hot NFP = AI capex demand approaching a ceiling) is on the table; it is what we will be re-testing against MU’s own guide in two weeks. The framework holds. The trim ladder still runs.
The plan from here. Hold the remaining position through the print. If MU runs back to $1,100 before June 24, the second trim still fires — same trigger, same one-third reduction. If MU drifts in the $900–1,050 range into the print, we hold and let the call decide. If the print confirms our scenario tree base case ($34–35B revenue / 82–83% GM / $20–22 EPS), the second trim becomes live the morning after. If management strikes any defensive tone on HBM3E ASPs or walks back FY27, exit a second tranche on the call regardless of price.
Chart 1 — What 17 trading days look like
$668 to $923.52, with seven sell-side raises along the way. The first trim trigger fired on the last bar.
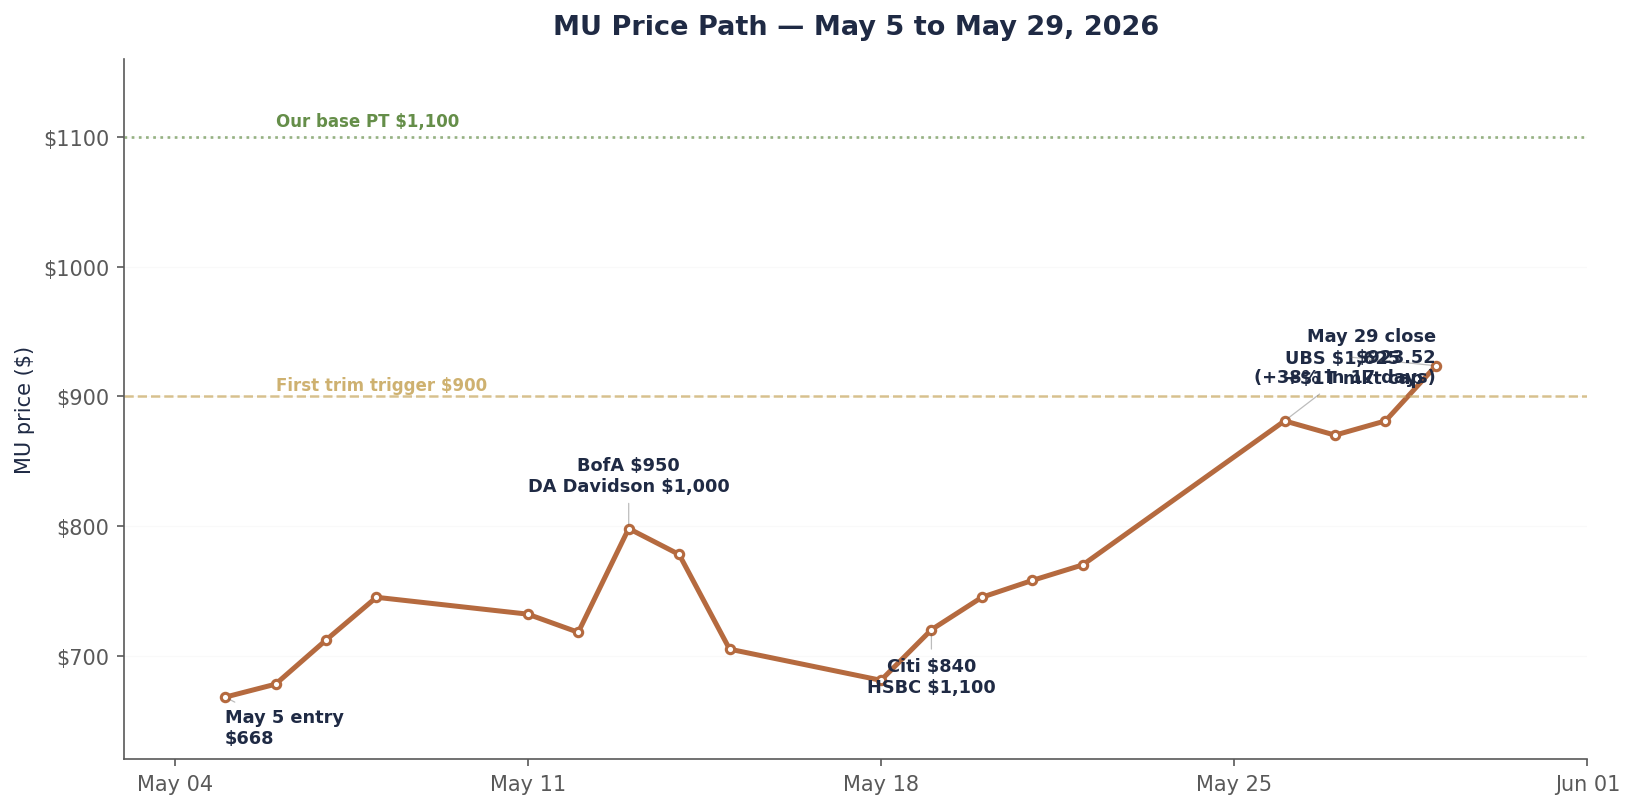
Five-week round trip from contrarian conviction to consensus stampede. Source: closing prices via Yahoo Finance; sell-side notes via Bloomberg / firm disclosures.
Why June stops being a sell-side story
Through May, the move was driven by analysts catching up to math that was already on the page. DRAM contract prices had moved 90–95% QoQ in Q1 2026 (per TrendForce contract pricing data). Hyperscaler capex guides were the largest in the history of the industry. Micron itself had already printed 75% gross margin in FQ2. The estimates had to come up. Analysts came around to it in sequence. The stock came around to it in compressed time.
That’s a story that runs out. There are only so many banks left to capitulate. Goldman is still the lone NEUTRAL on the name — though they’ve quietly walked their PT from $235 in December all the way to $400, while keeping the rating unchanged. Morgan Stanley’s $450 OVERWEIGHT was set back in February and called MU the firm’s top US semi pick — they haven’t needed to chase. When everyone else above $1,000 becomes consensus, the next leg has to come from somewhere other than sell-side mathematics.
It has to come from company numbers. From the actual income statement. From forward guidance. From management saying out loud what the spreadsheets have been implying.
The cleanest test arrives on Wednesday June 24, after the close. Micron reports fiscal Q3 2026 (the quarter ending May). It’s the first earnings print since the whole memory complex re-priced. Every number management gives is going to be measured against the run-up — not against last quarter, not against last year, but against the $1 trillion the market has now decided the company is worth.
The bar Micron has to clear
Here’s what management guided when they reported FQ2 on March 18, 2026 (per Micron’s FY2026 Q2 8-K). Coming off a quarter that printed $23.86B in revenue at 75% non-GAAP gross margin and $12.20 in EPS, the company told the Street to expect this:
| Line | FQ3'26 guide | vs FQ2'26 actual | vs FQ1'26 (two quarters ago) |
|---|---|---|---|
| Revenue | $33.5B ± $0.75B | +40% QoQ from $23.86B | +146% from $13.64B |
| Gross margin | ~81% | +600bp from 75% | +2,420bp from 56.8% |
| Non-GAAP EPS | $19.15 ± $0.40 | +57% from $12.20 | +roughly 4× from $4.78 |
| OpEx | ~$1.4B | roughly flat | +slight |
Numbers like those are difficult to internalize. A quarterly revenue figure that, alone, exceeds Micron’s entire fiscal 2023 revenue of $15.5B (per the Micron FY2023 10-K). A non-GAAP gross margin profile that puts a memory company in the same neighborhood as software. EPS of $19 in a single quarter — the stock didn’t close above $63 across all of 2018, the previous cycle peak.
What anchors the stock at $923 isn’t that bar by itself. It’s the question of whether management is sandbagging again. The last two quarters they did:
Chart 2 — Revenue, gross margin, and the beat pattern
The last verified quarter beat its guide by 28% on revenue and 7pp on margin. June 24 tells us if that pattern holds.
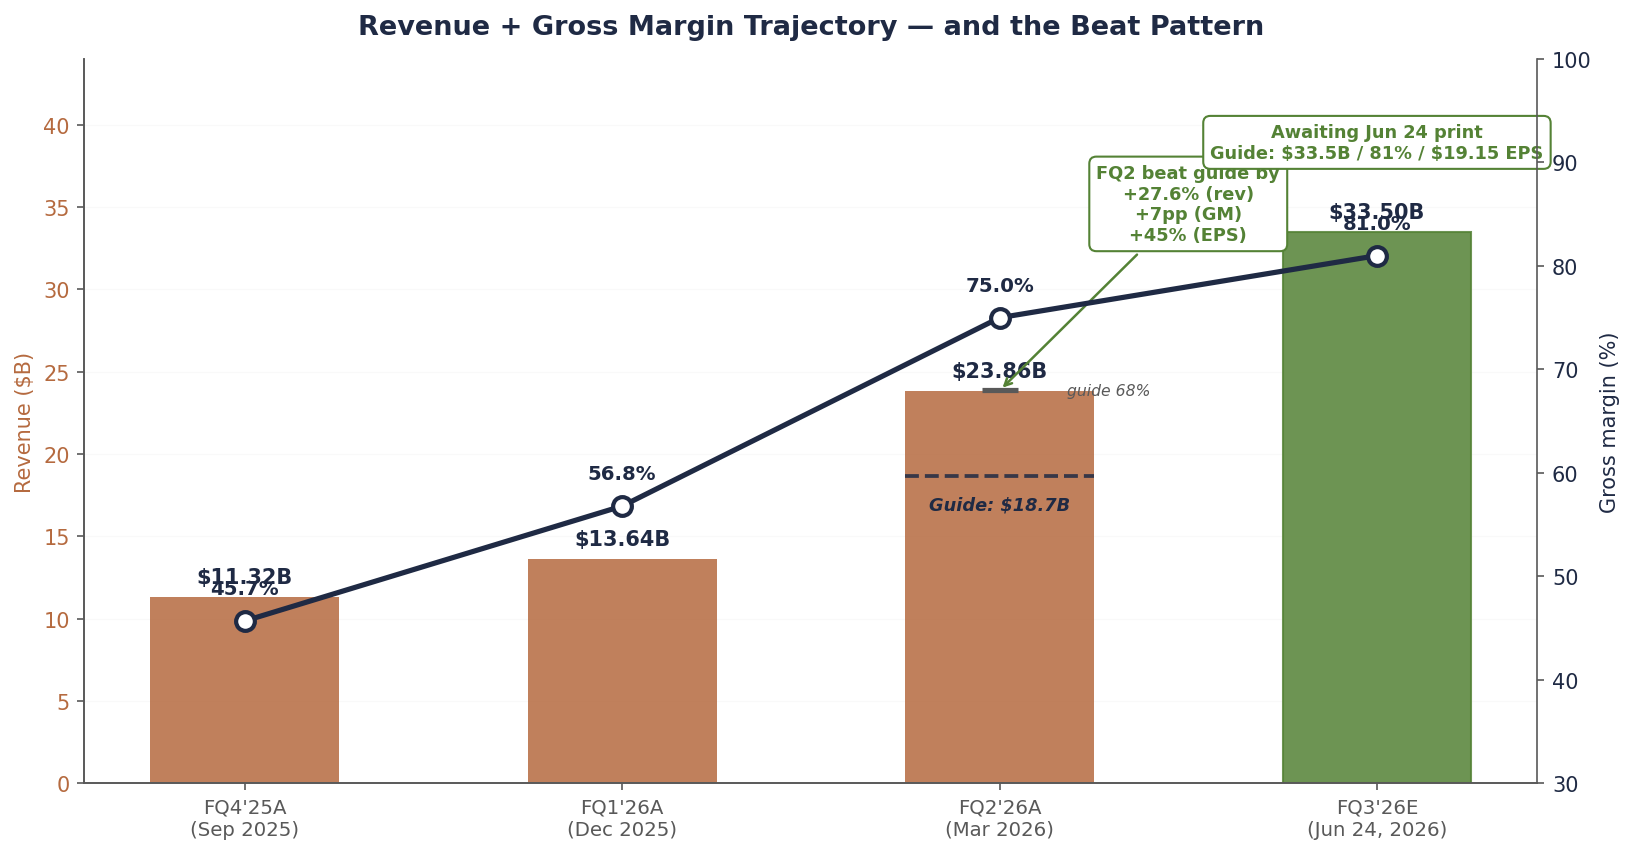
Bars are actual revenue; the dashed line in the FQ2 bar shows where management originally guided when reporting FQ1. The 7pp GM beat on FQ2 is what produced the EPS surprise of $12.20 vs $8.42 guide. Source: Micron 8-K filings (FY25 Q4, FY26 Q1 and Q2 press releases), company guidance.
Two quarters of evidence is a pattern, not a guarantee. But it’s also the strongest possible signal we have about management’s posture: in this cycle, they’ve been conservative every single time. The right question isn’t whether $33.5B/$19.15 prints. It’s how far above those numbers it prints, and whether that’s already in the stock at $923.
What I’m actually watching on the print
The headline beat is almost ceremonial at this point. Three out of the last four quarters Micron has beaten the top of the range. The pricing data through May suggests they should again. The interesting reads aren’t whether they beat — it’s how, and what comes after.
One. Gross margin trajectory. 81% is a number that doesn’t sit comfortably in a memory company’s P&L. If they print 82–83%, the bull thesis (memory has structurally rerated, AI is permanent demand) gets actual fundamental support. If they print 79–80%, the bear thesis (this is peak; mix and ASP are already rolling) gets its first echo. The range matters more than the point.
Two. Forward guide for FQ4 and color on FY27. The Street is modeling FQ4 above the FQ3 guide. Anything that anchors FY27 EPS at or above $80 (against the $100 we’ve been using) keeps the trim ladder running. Anything that walks back FY27 commentary — even tonally — is the cycle-end signal we’ve been calibrated for since April.
Three. HBM3E ASP commentary. TrendForce flagged this in April: any 5%+ sequential decline in HBM3E contract pricing would compress margins meaningfully. If management strikes a defensive tone on HBM pricing for the second half — that’s the first place a cycle starts to roll. I will be re-reading the prepared remarks specifically for this line.
Four. Capex. Samsung’s $73B 2026 capex is the largest single-year semi spend in history. Micron’s response is the cleanest read on whether management thinks the pricing environment is durable. A capex guide that ramps Idaho aggressively into FY28 reads as confidence. A capex guide that throttles back reads as discipline — or fear.
The scenario tree (not a point prediction)
The honest answer to “what do you think prints” is that the range of defensible outcomes is wide enough that pretending I know the number is a tell. Here’s what I actually think the matrix looks like, given verified contract pricing data, the FQ2 beat pattern, and what management was hinting at on the last call:
| Scenario | Revenue | GM | Implied EPS | What it means |
|---|---|---|---|---|
| Guide in line | $33.5B | 81% | ~$19.15 | Management called it perfectly. First time this cycle. Stock probably fades 3–5% on perceived lack of upside. |
| Modest beat (base case) | $34–35B | 82–83% | $20–22 | Most likely outcome. Beats consensus but not by enough to re-rate. Stock holds $900–1,000 range. |
| Big beat (FQ2 pattern repeats) | $36–38B | 83–85% | $23–26 | Validates the cycle-extension thesis. Stock breaks $1,000 the next morning. My second trim at $1,100 fires within days. |
| Negative surprise | <$32.5B | <79% | <$18 | HBM ASP softness or a cost miss. Cycle-end signal. Stock to $800–850. I exit a second tranche regardless of price. |
The reason I’m not putting a point estimate on this: I genuinely don’t know which of those four lands. The probabilities below are illustrative subjective priors, not implied options or sell-side odds. The base case is most likely (~50%), the big beat is second-most-likely (~25%), guide-in-line is third (~20%), and the negative surprise is the tail (~5%). Those priors come from pattern recognition, not proprietary channel checks.
What I’m more confident about: the forward commentary on FQ4 and FY27 matters more than the print itself. UBS’s $1,625 PT requires roughly $100+ in FY27 EPS. DA Davidson’s $1,500 is similar. If management gives any tonal signal that walks those numbers down, the stock cracks regardless of how good the in-quarter beat looks. If management leans into FY27 the way they leaned into FQ3 last quarter, the rally has another leg.
The stock reaction is mostly a function of how stretched current consensus already is. Sell-side estimates for FY27 EPS have moved meaningfully higher across the May cascade. If the call validates $100+, those PTs hold. If it validates $80–85, the higher PTs start looking aspirational.
The June calendar (in one screen)
For context, the macro calendar this month is dense and the FOMC at the end of it is the next real test. For the broader macro setup — PCE, labor, the rotation within the AI complex — see the May 31 weekly recap. Here are the discrete events that move this position:
| Date | Event | Why it matters for MU |
|---|---|---|
| Jun 1 (Mon) | May ISM Manufacturing — printed 54.0 (5-month expansion, highest since May 2022) | Production-side cooling read came in hot. Supportive risk backdrop, mildly hawkish for the Fed. |
| Jun 5 (Fri) | May Nonfarm Payrolls — printed +172k vs +80k consensus (per BLS) | Already triggered the Jun 4-5 tape break. Discussed in the update above. |
| Jun 10 (Wed) | May CPI release (8:30 ET) | FOMC dress rehearsal. If core CPI prints sticky again, the post-PCE 10Y rally reverses. Discount rate is one of the few things that can stall an AI-led tape. |
| Jun 16–17 (Tue–Wed) | FOMC meeting + SEP | The dot plot matters more than the decision. If 2026 median dots remove a cut, multiple compression starts in semis first. |
| Jun 24 (Wed, after close) | MU FQ3 earnings | The print and the call. The single highest-information event of June for this position. |
| Jun 24–25 | SK Hynix HBM4 production milestone (expected) | Hynix is targeting initial HBM4 sampling. Any slip or pull-forward changes the supply-side narrative. |
| Jun 26 (Fri) | May PCE release | Anchors the second-half-of-the-year rate path. Less binary than CPI but more weight in the Fed model. |
What jumps out is that MU’s print lands a week after FOMC. By the time we hear from Mehrotra, the rates picture for the rest of the year is set. The market will know whether we’re in “dovish hold” or “hawkish pause” before the most important AI-cycle data point of Q2 hits the tape. That sequencing is unusually clean.
Where the sell-side actually stands today
Eight notable changes since the May 28 piece. DA Davidson raised PT from $1,000 to $1,500 (May 28) — sits exactly on our bull case. Barclays raised from $675 to $1,175 (May 27). Mizuho raised a third time, from $800 to $1,150, after two prior raises in May. Susquehanna raised from $600 to $1,750 (May 29) — the new Street high above UBS, a $125 premium and a 192% increase in one note. Raymond James doubled from $530 to $1,100 (June 1). And then, through the Jun 4–5 selloff, two more capitulations landed on Monday Jun 8: Wells Fargo raised PT from $550 to $1,220 (+120%; Buy reiterated) and Cantor Fitzgerald raised from $700 to $1,500 (Overweight; analyst C.J. Muse called MU a “top pick” with memory undersupplied through 2028). Also: Goldman strategist Ben Snider hiked the S&P 500 target to 8,000 on May 27 (per Bloomberg coverage of the strategy note), naming Micron and NVIDIA as roughly a third of 2026 S&P EPS growth — while Goldman’s single-stock desk kept MU at NEUTRAL.
The pattern of those last two raises matters. Both Wells Fargo and Cantor raised after Broadcom’s Q3 total revenue guide came in slightly light of the most aggressive Street estimates and after the worst single session on the semiconductor index since April 2025. If the sell-side read either of those as cycle-end signals, you would not see another +120% PT raise on the same name three sessions later. You would see PT cuts. We got the opposite.
Chart 3 — Sell-side PT distribution, updated through June 8
Wells Fargo + Cantor raised through the drawdown. Eleven of eighteen actions at or above our base PT.
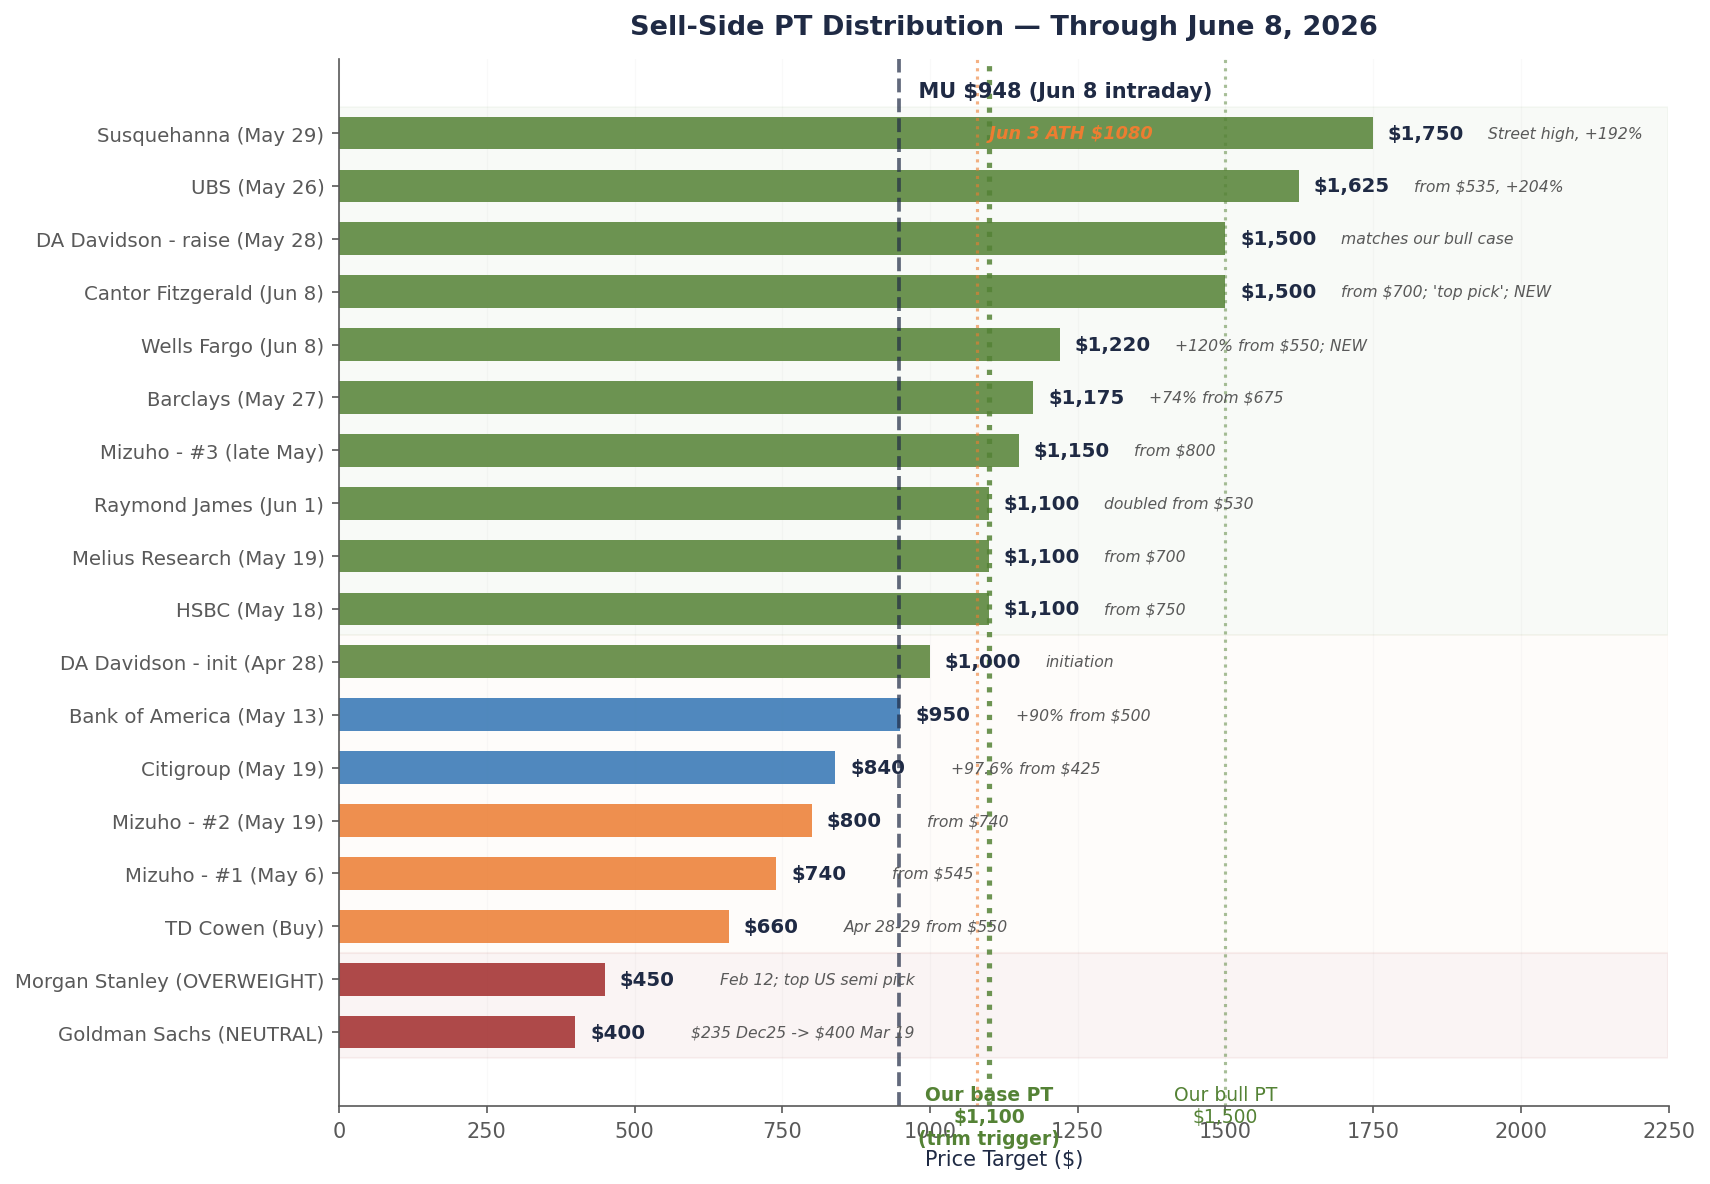
Spot price line is the June 8 intraday level around $948 — about 12% below the Jun 3 closing all-time high of $1,079.57. Goldman and Morgan Stanley still below current. Wells Fargo (Jun 8, +120% from $550) and Cantor (Jun 8, “top pick”) raised through the drawdown — the cleanest signal that the sell-side reads the pullback as positioning, not fundamentals. Source: bank notes via Bloomberg, Investing.com, MarketBeat, TipRanks, Gurufocus, Finbold, firm disclosures.
The cross-confirmation read — Goldman’s strategy desk endorsing the MU earnings thesis while Goldman’s single-stock desk stays NEUTRAL at $400 — is exactly the kind of internal dissonance that resolves loudly when someone capitulates. I’d watch for a Goldman PT raise sometime in the next four weeks. Morgan Stanley at $450 OVERWEIGHT is the other obvious candidate — their February PT was set when MU was below $200; they’ve had MU as their top US semi pick the whole way up.
Position update and what fires next
I trimmed one-third on Friday May 29 at an average fill of $919, moving the position from roughly 6% of book down to 4%. Cost basis on the remaining two-thirds is unchanged. The trim ladder continues:
| Trigger | Action | Where we are |
|---|---|---|
| Fired 5/29 at $923.52 (avg fill $919). Position now ~4% of book. | ||
| $1,100 | Second trim (another third) | Did not fire. Peaked Jun 3 at $1,079.57 ($20 short). Trigger still live; ~16% above current $948. |
| $1,400 | Third trim (another third) | 48% above current. Approaching bull case. |
| $1,500+ | Full exit, or any kill-shot | 58% above current. UBS, DA Davidson, Cantor, Susquehanna $1,750 all above. Where we step off. |
The framework keeps doing its job. The first trim was mechanical — the trigger fired, I sold, no decision required. That’s the point of pre-committing. The hardest part of this trade was always going to be selling into strength while the narrative still felt durable. The ladder makes that decision in advance, so the in-moment version of me doesn’t have to be strong-willed about it.
Three things would change the plan before the next rung:
A clean miss on FQ3 revenue or guide. Stock back to $800–850 range. I hold the remaining position; the thesis is intact at lower multiples and the cycle just got a little longer. No additional buying — we already own enough.
HBM3E pricing softness in the call. This is the kill-shot I’ve been calibrated for. If management language goes defensive on HBM ASPs for second-half FY26, I exit a second tranche immediately on the call regardless of stock price.
Hyperscaler capex revision downward. Watch the FY27 capex guides as MSFT/GOOG/META report in July. Any meaningful cut from the current $745B aggregate is the leading indicator that supply > demand by 2028 starts pulling forward.
None of those have happened. Most of them probably won’t. The base case is that June is a confirmation month, the print is good, and the discipline plays out the way it’s designed to. But the framework only works if I’m as willing to fire it on bad news as I was on good.
I’ll write the follow-up the morning of June 25.
One-page summary
| Item | Status |
|---|---|
| Rating | BUY (with trim discipline) |
| Last reference | ~$948 intraday (Jun 8, 2026) |
| Recent ATH | $1,079.57 (Jun 3, 2026 close) |
| Recent low | $864.01 (Jun 5, 2026 close after −20% in 2 days) |
| Market cap | ~$1.06T at $948 (was $1.22T at the ATH) |
| 12-month base PT | $1,100 (unchanged) |
| Bull case PT | $1,500 (now matches DA Davidson + Cantor) |
| Bear case PT | $280 (cycle-end scenario) |
| Position size | ~4% of book (post first trim; second trim did not fire) |
| Next decision date | June 24 FQ3 print — or $1,100 touch if it comes first |
| Next trim trigger | $1,100 (16% above current $948); same mechanical trigger |
| Cycle catalysts to watch | Broadcom Q3 total rev guide light Jun 4; Wells Fargo + Cantor raised through it Jun 8 |
| Kill-shot triggers | HBM3E ASP softness in call; FY27 walk-back; hyperscaler capex cut |
| FQ3 guide (the bar) | $33.5B rev / 81% GM / $19.15 EPS |
| My FQ3 base case (~50% illustrative prior) | $34–35B rev / 82–83% GM / $20–22 EPS |
| FQ3 upside case (~25% prior) | $36–38B rev / 83–85% GM / $23–26 EPS (FQ2 pattern) |
| FQ3 downside case (~5% prior) | <$32.5B rev / <79% GM / <$18 EPS (kill-shot) |
Disclosure: I/we have a beneficial long position in the shares of MU either through stock ownership, options, or other derivatives. Position was reduced by approximately one-third on May 29, 2026 per the published trim ladder. I wrote this article myself, and it expresses my own opinions. I am not receiving compensation for it. I have no business relationship with any company whose stock is mentioned in this article. This is research and analysis only, not personalized financial advice. This commentary is for informational and educational purposes only and does not constitute investment, tax, or legal advice or a solicitation to buy or sell any security. Past performance is not indicative of future results. Readers should conduct their own research and consult a qualified financial professional before making investment decisions. Sources include Micron IR disclosures and 8-K filings, sell-side notes (UBS, BofA, HSBC, Melius Research, DA Davidson, Barclays, Citigroup, Mizuho, TD Cowen, Morgan Stanley, Goldman Sachs), TrendForce DRAM contract pricing reports, Counterpoint Research HBM share data, hyperscaler Q1 2026 earnings transcripts, Korean Ministry of Trade export statistics, and Bloomberg consensus data. See disclaimer.